
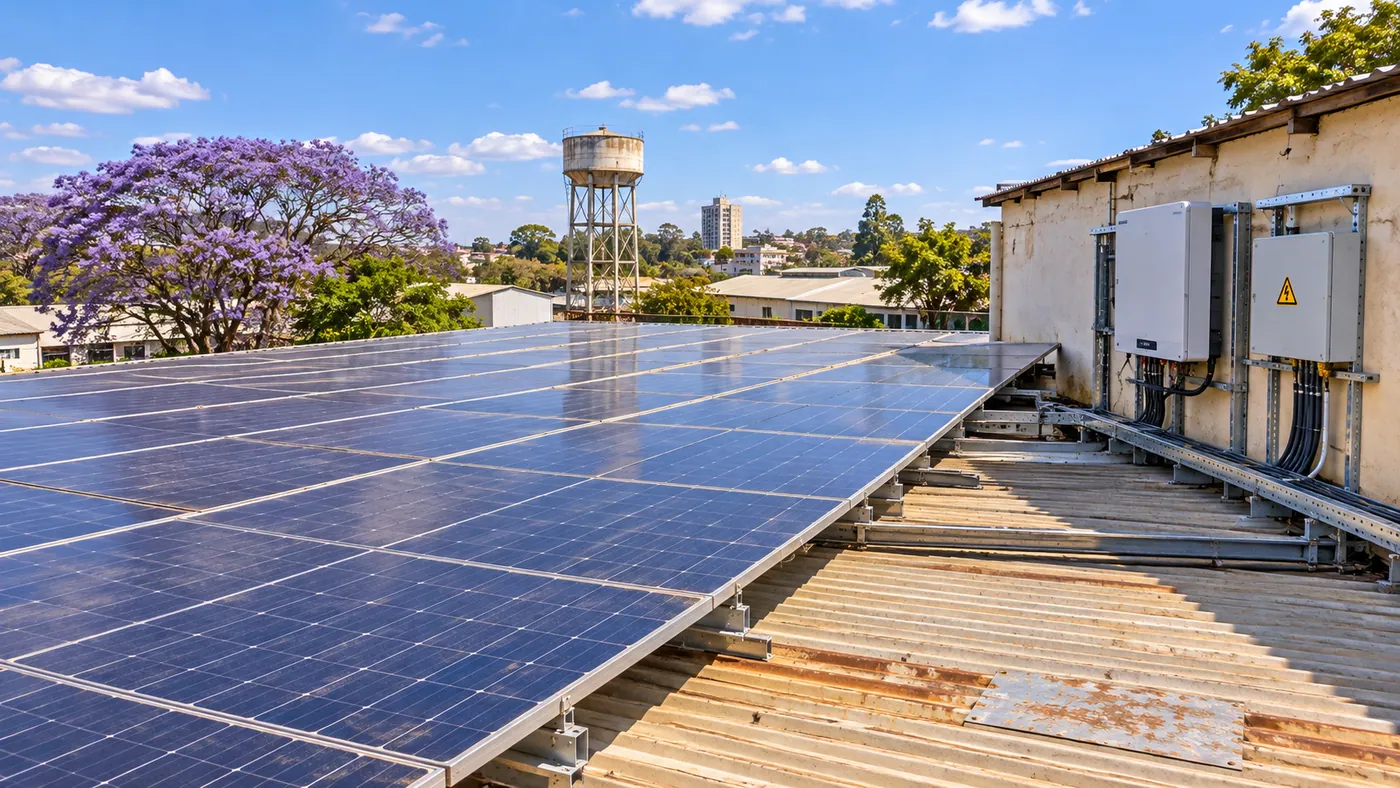
Is solar worth it for your factory? A feasibility study explained
Solar can save money for years, but only if it suits your site. A feasibility study gives you real numbers for your load, roof and tariff.
In this article
- The yardsticks, in plain words
- Step 1: Understand the load
- Step 2: Assess the site
- Step 3: Model the energy
- Step 4: Test the economics
- A worked case: a 640 kWp plant for a 180,000 kWh a month site
- What moves the answer most
- When solar does not pay
- The benchmarks investors use
- Step 5: Check the rules
- Step 6: Decide how to finance it
- Five numbers to pull out of any quotation
- Ten questions a board or a lender will ask
- What a good study delivers
- How AVEX GRID helps
Key points
- In our 640 kWp example, solar costs about 9 US cents a unit against 11 from the grid. The saving depends on the price you pay.
- Solar only helps with what it replaces, which is grid or diesel power. So the study starts with your load profile, not with the panels.
- Panels produce in daylight. How much of your load runs in the day decides how much solar you can use directly.
- Roof condition, shading, space and strength decide how much can be installed and at what cost.
- Since July 2026, own-use plants from 100 kW to 10 MW must register with ZERA before building. Above 10 MW you need a licence.
Companies often ask whether solar is worth it. The honest answer is that it depends on four things. First, when you use power. Second, how much space and sun you have. Third, what you pay for the energy you replace. Fourth, how the project is financed and licensed. A feasibility study tests each of the four. It then gives you a decision you can defend to your board or your bank.
The yardsticks, in plain words
A solar decision rests on a handful of numbers. If two quotations use them differently, you cannot compare them. Here is what each one tells you.
| Number | In plain words | What to look for |
|---|---|---|
| Yield | kWh made a year per kWp installed | About 1,600 to 1,700 kWh per kWp in Zimbabwe |
| Capacity factor | How hard the plant works over the year | Roughly 18 to 20% for fixed solar |
| Performance ratio | Quality of the build and upkeep | 0.75 to 0.85. Below 0.70 means a problem |
| LCOE | Cost of each solar kWh over the plant's life | Well below your all-in grid price per kWh |
| Payback | Years to get your money back | Under about five years is strong |
| NPV | What the project is worth today | Positive means it beats your cost of money |
| IRR | Yearly return on the money | Above your cost of funds, with room to spare |
Step 1: Understand the load
The study starts with 12 to 24 months of your bills. It also uses a measured profile of your load over a typical week. The question is how much of your demand happens in daylight. A day-shift factory with refrigeration uses most of its energy while the sun is up. A 24-hour operation can use solar for a smaller share, unless you add batteries.
Step 2: Assess the site
- Area and orientation. The roof or ground area, and the tilt and direction of the panels, set how much capacity fits.
- Structure. The roof must carry the extra weight and the wind forces. An engineer checks its condition before the design is fixed.
- Shading and dirt. Nearby buildings, trees and dust reduce output. We include them in the yield model.
Step 3: Model the energy
An hour-by-hour model compares the expected solar output with your load. It shows how much of the solar energy you use on site and how much is surplus. It also shows what share of your demand is covered. The model uses sunlight data for your location. It also uses standard allowances for losses from heat, wiring and the inverter.
| Result | Why it matters |
|---|---|
| Annual energy produced | The basis of every saving figure |
| Self-consumption share | The part of the output you use directly. This decides the value |
| Share of demand covered | Shows how far the plant reduces your grid or diesel purchases |
| Peak-demand effect | Solar often cuts your energy use more than it cuts your monthly peak |
Step 4: Test the economics
Three measures are normally reported. First, the levelised cost of energy (LCOE) is the total cost of the plant over its life, divided by the energy it produces. You compare it with the tariff or diesel cost per kWh that the solar replaces. Second, the payback period is the time your savings take to repay the investment. Third, the internal rate of return compares the project with other ways you could use your money.
A well-designed system in most of Zimbabwe produces roughly 1,600 to 1,800 kWh per kWp a year. Source: AVEX GRID calculation; yield from the Global Solar Atlas range.
A worked case: a 640 kWp plant for a 180,000 kWh a month site
To see how the pieces fit, take a day-shift plant that buys 180,000 kWh a month. 70% of its use is in daylight. The calculator sizes the solar to the daytime load. The result is a plant of about 640 kWp. It needs about 4,491 square metres of roof and produces 1,058,475 kWh a year.
The assumptions are the calculator's defaults. The installed cost is US$950 per kWp. The energy price you avoid is US$0.11 per kWh, rising 3% a year. The discount rate is 12% and the plant life is 20 years. You can edit each one. You should replace each with your own quotation and your own bill.
| Result | Value |
|---|---|
| Installed cost | US$609,425 |
| Share of total electricity use covered | 48% |
| Saving in year one | US$106,845 |
| Simple payback | 5.4 years |
| Internal rate of return | 19% |
| Levelised cost of solar energy | US$0.088 per kWh |
| Net present value at 12% | US$330,975 |
Compare the levelised cost of 8.8 cents with the 11-cent energy rate it replaces. Compare it also with the cost of diesel generation, which our diesel guide puts above 60 cents per kWh at current pump prices. Solar sits between the two, much closer to the grid price than to diesel. On a site that uses only grid power, the margin is real but not wide. That is why the inputs matter.
What moves the answer most
Run the same plant at different installed costs and the payback moves with it. Zimbabwean projects pay for imported equipment, transport and financing. So the installed cost is the input most worth testing.
Calculator defaults otherwise unchanged; no diesel saving included. Illustrative. Source: AVEX GRID calculator
Three other inputs move the answer almost as much. One is the price of the energy you replace. It rises with a tariff review and falls with a cheaper contract. Another is the share of output you use on site, which a daytime load raises. The third is the discount rate. This is what your money earns elsewhere, or what a lender charges you.
When solar does not pay
| Situation | Why it disappoints | What to do |
|---|---|---|
| Night-time or 24-hour load with no batteries | Little of the output is used when it is made | Add batteries, or move loads into daylight |
| Small daytime load on a big roof | The extra power has no buyer unless you can export it | Size the plant to the load, not to the roof |
| Weak or shaded roof | Strengthening the roof and shading cost you output and money | Use ground mounting, a carport or a smaller array |
| Very cheap supply contract | You save little on each kWh | Test at today's contract price and at the next tariff |
| High finance cost | The finance cost wipes out the margin | Compare buying, leasing and a power purchase arrangement |
The benchmarks investors use
The International Renewable Energy Agency (IRENA) published a cost report for 2024. It puts the global average installed cost of large solar plants at US$691 per kW. It puts their levelised cost at US$0.043 per kWh. It puts large battery systems at US$192 per kWh. These are world averages for very large plants. They are not rooftop prices for Zimbabwe. They are still useful in two ways. They show how far costs have fallen. They also show the gap that size, transport, duty and financing create at a single site. A study explains that gap line by line. Your board then knows which part is price and which part is risk.
Step 5: Check the rules
Since July 2026 the route depends on size. Under Statutory Instrument (SI) 126 of 2026, a plant for your own use above 10 MW needs a ZERA licence. A plant between 100 kW and 10 MW must be registered with ZERA before you build. You need a grid impact assessment, company documents and proof that you can use the land. You also need an environmental impact assessment or an exemption letter from EMA. Registration costs US$10 excluding VAT. Before the plant operates, you must file a notice with its commissioning certificate. A study sets out this route early. It also covers the grid connection studies and how the plant works with net metering. Our guide to own-consumption solar goes through it step by step.
Step 6: Decide how to finance it
- Buy outright. You save the most over the plant's life, but you pay the most at the start.
- Lease or finance. This spreads the cost, but you pay a financing charge.
- Power purchase arrangement. A third party owns the plant and sells you the energy under a contract. The technical file is the same.
Five numbers to pull out of any quotation
- Installed cost per kWp, and what it includes. Check for the mounting structure, cables, protection, commissioning and permits.
- Annual energy in kWh, and the yield per kWp it implies. In Zimbabwe, expect 1,600 to 1,800 kWh per kWp.
- The guaranteed performance, and how it is measured.
- The warranty terms for the panels, inverters and workmanship, in years and conditions.
- The running cost: cleaning, monitoring, replacing inverters and insurance.
Put these five numbers on one page and two quotations become comparable. You can then rebuild the economics from the figures, not from the sales summary.
Ten questions a board or a lender will ask
- Is the plant sized on a measured load profile?
- What is the full cost of the energy it replaces, including the demand and reactive power charges?
- What share of the output do you use on site, and what happens to the rest?
- What is the installed cost per kWp, and what does it include?
- What are the levelised cost, the payback and the return? How do they change if cost or tariff changes?
- What is guaranteed: output, uptime, workmanship, the inverter and the panels?
- Which approvals apply, and which do you already have?
- What does the grid impact assessment say?
- Who runs and maintains the plant, and how is performance reported?
- Has an independent engineer reviewed the design and the quotation?
The first answers come from your bill, so read it closely: how to read your ZETDC bill. The battery question follows in sizing solar plus battery.
What a good study delivers
- A sized design with a single-line diagram and a layout.
- An energy model and a financial model, with the assumptions stated.
- The licensing and grid connection route.
- A clear recommendation: build, build smaller, add batteries, or do not build.
How AVEX GRID helps
- Feasibility studies built on your measured load and a site inspection.
- Technical files for ZERA and ZETDC and for lenders.
- Bid review, so that supplier quotations are compared on the same basis.
What AVEX GRID can take off your hands
AVEX GRID is an engineer-led energy consultancy in Zimbabwe. We do the technical work that turns an energy investment into a plant that is licensed, connected, financed and performing, whether you are a local operator or an investor overseas.
We quote fixed prices after a free scoping call and reply the same working day.
Frequently asked questions
What installed cost should I expect?
Our calculator defaults to US$950 per kWp for a commercial roof, with an indicative range of US$700 to US$1,400. Only a quotation for your roof sets the real figure. Global utility-scale averages from IRENA, around US$691 per kW, are a benchmark for scale, not a price for Zimbabwe.
Do I have to register a solar plant with ZERA?
Under SI 126 of 2026, a plant for own consumption between 100 kW and 10 MW registers with ZERA before construction, and above 10 MW it needs a licence. Smaller grid-connected systems follow the net-metering rules. We confirm the route for your site.
How big a roof do I need?
As a rule of thumb, a modern solar plant needs roughly six to seven square metres per kWp on a flat or lightly pitched roof. The study confirms the usable area after shading and access are considered.
Will solar cover all of my demand?
Seldom. Solar covers part of your daytime demand. Batteries or the grid supply the rest. The model shows the share covered.
Does solar reduce the maximum demand charge?
It can, but not reliably. Your peak can happen when the sun is low or clouded over. A study checks the effect using your load profile.
How long does a feasibility study take?
Usually a few weeks. It depends on how quickly you give us your data and when we can visit the site.
Sources and notes
General information to help you plan. The rules that apply to your site are confirmed by AVEX GRID against the current gazetted text, ZERA and ZETDC as part of the work. The sources used are listed below.
- IEC 61724-1: photovoltaic system performance, monitoring (performance ratio)
- Sandia PV Performance Modeling Collaborative: performance ratio
- IRENA: Renewable power generation costs in 2024
- Veritas: SI 126 of 2026, Electricity (Own Consumption Undertakings Licensing Capacity) Regulations
- Global Solar Atlas: solar resource data
- IEC 61724: photovoltaic system performance monitoring
- CrossBoundary Energy: distributed energy resources regulation, Zimbabwe
- ZERA: Zimbabwe Energy Regulatory Authority